Housing Graphs To Go is a new Shareables type that lets you generate data visualizations of key local market statistics and share them with your clients. This article walks you through selecting a category, timeframe, and area, and sharing your finished graphic. This feature is available to paired agents and loan officers with an Elite ListReports subscription.
Navigating to Housing Graphs To Go
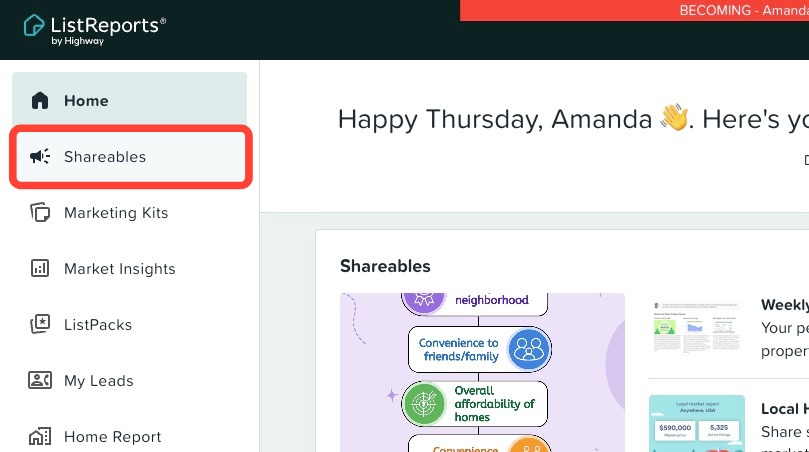
You can find Housing Graphs To Go within the Shareables tab inside ListReports.
- Click Shareables in the left-hand navigation menu.
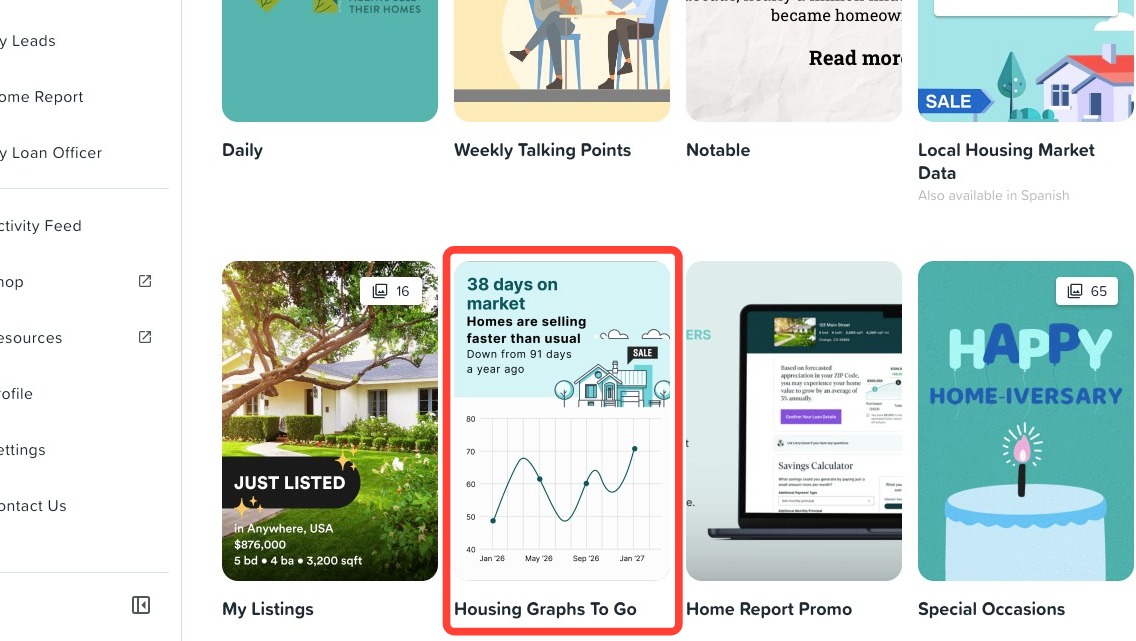
- Scroll down and select the Housing Graphs To Go tile.
Creating a Housing Graphs To Go Shareable
- Click the Select a market topic drop-down to choose the type of market data you'd like to visualize:
- Median Listing Price
- Price vs Inventory
- Days on Market
- New Listings
- Active Listings
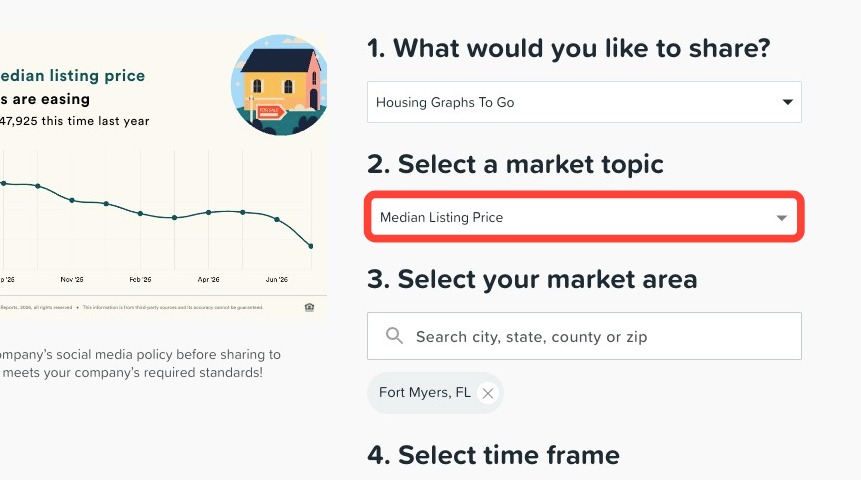
Each graph includes a contextual caption to help your clients understand the data at a glance.
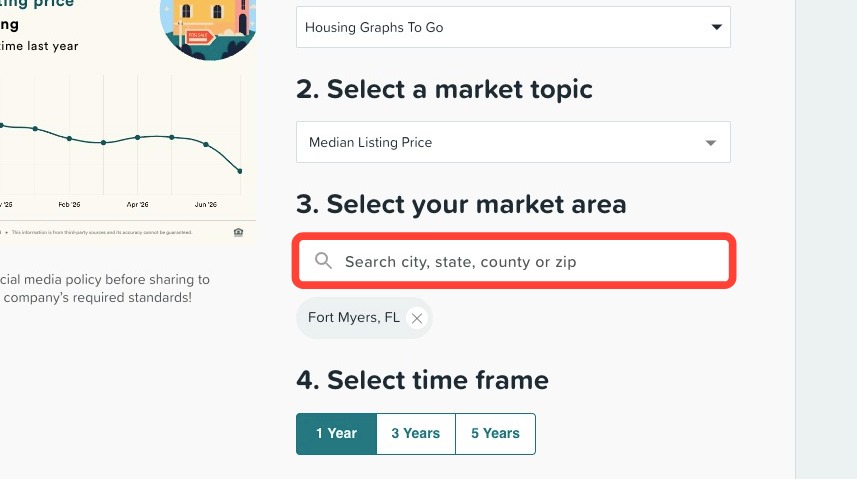
- Search for a city, state, county or ZIP code in the Select your market area field.
- Choose the area by clicking Add.
- Select a time frame
- 1 year
- 3 years
- 5 years
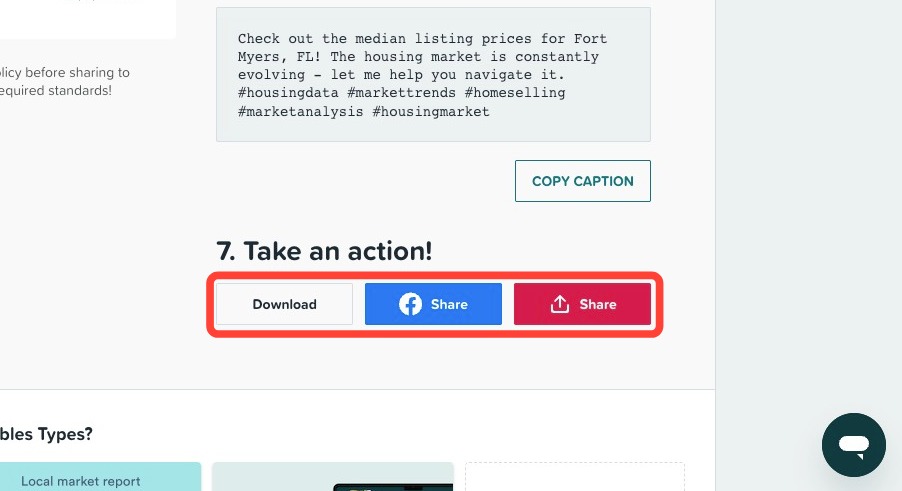
- Choose how you would like your Graph's To Go Shareable to be shared:
- Download (great for Instagram)
- Facebook (personal or business account)
- Share (including email, X, LinkedIn, and copy link)
💡 Helpful Tip: Sharing multiple categories over time gives your clients a fuller picture of their local market, and gives you more reasons to stay in touch. |
Need Help?
Have more questions or want to learn more? Click here to submit a support ticket.